

A photometric report is the lab-measured performance record for a single luminaire, built on IES LM-79 testing and packaged with an .ies file for design software. Open one and check three things first: total lumens and efficacy, the candela distribution plot showing beam shape, and the test standard with lab accreditation. Those three checks tell you whether the fixture will do the job before you ever place an order.
TL;DR:
- A photometric report should include total lumens, efficacy, and an accredited LM-79 test standard to verify the fixture’s true performance potential.
- The candela distribution plot, especially the full set of C-plane data, reveals whether the fixture is symmetric and suitable for correct orientation on site.
- Confirm that the report includes an actual .ies file paired with the measured illuminance grids at realistic mounting heights for accurate software simulation.
- Comparing initial values with real-world conditions requires applying lumen depreciation factors between 0.7 and 0.9 to maintain long-term compliance.
- Always verify that the report contains luminaire lumens, the LM-79 reference, and an accessible, correctly oriented .ies file before finalizing fixture specifications.
Table of Contents
- Photometric Report Basics: What’s Actually Inside the Document
- How Do You Read a Candela Distribution Plot?
- Making Sense of Foot-Candle Grids and Uniformity
- Five Metrics to Check in Every Photometric Report
- IES Files and the Software Workflow
- Common Mistakes and a Fast Verification Routine
- Report vs. Plan vs. Study: Which One Do You Actually Need?
- Trust and Verification: LM-79, Labs, and Canadian Considerations
- Practical Next Steps for Canadian Buyers and Designers
- Why Reading a Photometric Report Actually Changes Project Outcomes
- Where to Find Spec Sheets and Trade Support
- Sources
- FAQ
Photometric Report Basics: What’s Actually Inside the Document
Every photometric report follows a similar structure, and once you know where to look, the whole thing takes about two minutes to scan. The cover page carries the fixture ID, catalog number, the testing lab’s name, an LM-79 reference number, and a test date. That date matters more than people think. LED technology changes fast, and a report from a few product generations back may not reflect the fixture you’re actually buying today.
The next block covers output and power. You’ll see luminaire lumens (not raw LED chip lumens), input watts, luminous efficacy in lumens per watt, and often a rated life expressed as L70, the point at which output drops to 70% of initial. Efficacy is the number worth circling: it’s the metric utility rebate programs and energy codes care about most.
Color data comes next: correlated color temperature (CCT), chromaticity coordinates, and CRI with individual R-values, especially R9, which measures how well a light source renders deep reds. Some manufacturers now include TM-30 data alongside CRI, giving a fuller picture of color fidelity for retail and hospitality work.
Then come the numbers that actually describe how light leaves the fixture:
- Zonal lumen summaries break total output into angular bands (0 to 30 degrees, 0 to 60, 0 to 90, and so on), showing how much light falls into a tight downward cone versus spreading wide.
- Candela tables list light intensity at specific vertical and horizontal angles, the raw numbers behind the polar plot.
- The .ies file sits behind all of it as the machine-readable file that lighting software actually uses to calculate real-world light levels.
The printed report is for your eyes. The .ies file is for the software. You need both.
How Do You Read a Candela Distribution Plot?
The candela plot, sometimes called a polar plot, is the single most useful chart in the entire report, and also the most misread. Picture a set of concentric rings radiating out from a center point, each ring marking a candela value, with straight lines crossing through the center at different angles. Those lines are C-planes, essentially vertical slices through the fixture at 0, 90, 180, and 270 degrees. If all the C-plane lines trace roughly the same curve, the fixture is symmetric. If they diverge, you’re looking at an asymmetric distribution, common in wall washers and linear fixtures designed to throw light in one direction.
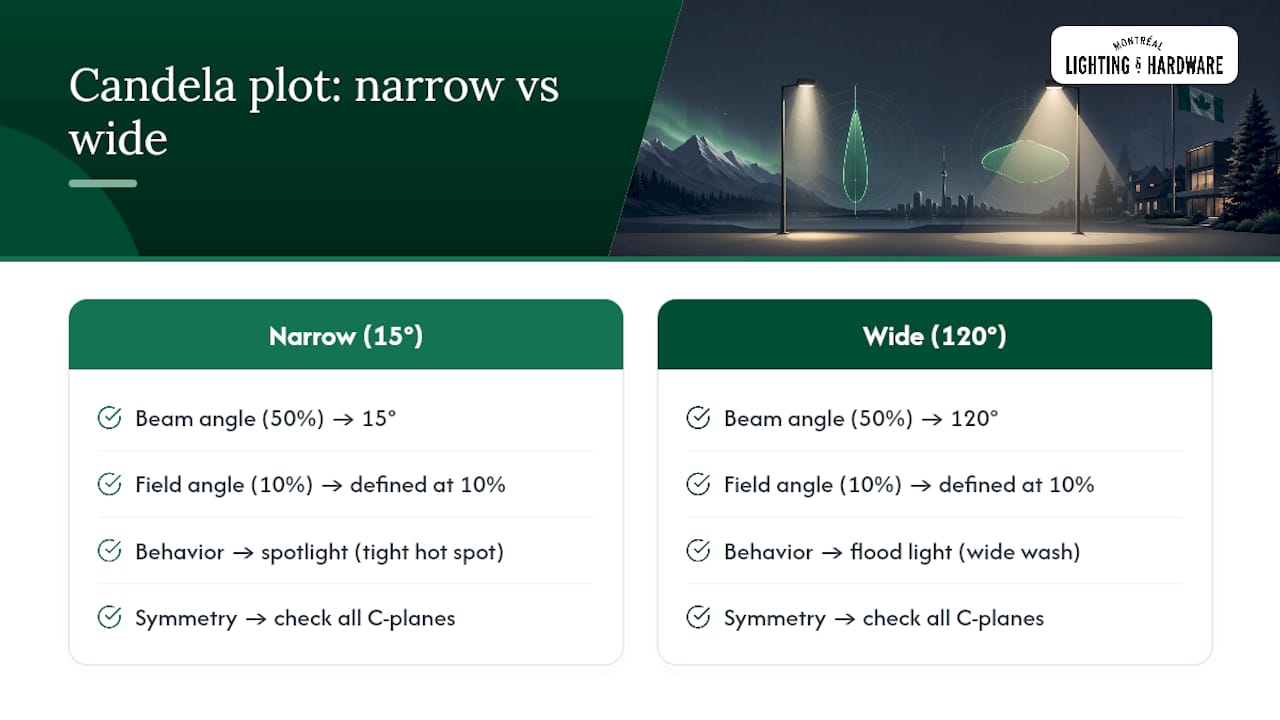
Two numbers define the usable beam: beam angle (where intensity drops to 50% of peak) and field angle (where it drops to 10%). A narrow 15 degree beam angle behaves like a spotlight; a 120 degree beam angle behaves like flood light. Peak candela, read at the center of the plot, combines with mounting height to predict illuminance on your target surface using the inverse square law: double the mounting height and you need roughly four times the candela to hit the same foot-candle level.
Pro Tip: If a spec sheet only shows one C-plane, ask for the full set. A single-plane plot can hide an asymmetric pattern that changes how the fixture should be oriented on site, and installing it backwards can quietly wreck your lighting layout.
A narrow beam fixture mounted too high will leave a bright hot spot surrounded by dim shadow, exactly the kind of mismatch a two-minute plot check catches before installation.
Making Sense of Foot-Candle Grids and Uniformity
Illuminance grids translate candela data into the light levels you’d actually measure on a surface, typically expressed in foot-candles for Canadian and US projects. The grid is only meaningful if you know the reference plane it’s measured on. Office work often uses a 30-inch horizontal plane; parking lots and walkways use ground level. Confirm the plane height before comparing numbers across two different reports, since a grid measured at floor level will read very differently from one measured at desk height.
Three figures matter most on any grid:
- Average illuminance — the mean foot-candle value across the whole grid, useful for checking against code minimums or design targets.
- Minimum illuminance — the darkest point on the grid, often the number that actually fails a code review even when the average looks fine.
- Maximum illuminance — the brightest point, useful for spotting hot spots near fixtures.
From those three, you calculate uniformity ratios: average-to-minimum and max-to-minimum. A retail aisle might target an average-to-minimum ratio of 4:1 or better; a parking lot standard might allow a wider spread. A low ratio means even light; a high ratio means patchy pools of brightness and shadow, which reads as uncomfortable even when the average number looks acceptable on paper.
One more wrinkle: report grids usually show initial values, fresh out of the box. Real installations lose output over time from lumen depreciation and dirt accumulation on the lens. A light loss factor between 0.7 and 0.9 converts those initial numbers into maintained illuminance, the figure code officials actually want to see for long-term compliance.
Five Metrics to Check in Every Photometric Report
Procurement meetings move fast, and nobody has time to read forty pages of test data line by line. These five checks cover most of what actually matters:
- Total lumens and efficacy (lm/W) — drives energy performance calculations and eligibility for utility rebate programs.
- Peak candela plus beam and field angle — determines whether the fixture suits the application and how far apart you can space units.
- CCT and CRI, including R9 — affects color fidelity for occupants, merchandise, and finishes, especially in retail and hospitality settings.
- LM-79 and LM-63 references with lab accreditation — the baseline signal that the data was measured under controlled, repeatable conditions rather than estimated.
- A usable .ies file paired with sample illuminance grids at realistic mounting heights for your project type.
Efficacy is worth extra attention because it’s the number tied directly to money. A fixture rated around 100 lm/W will use noticeably less energy than one rated at 60 lm/W for the same light output, and that gap compounds fast across a commercial fitout with hundreds of fixtures.
IES Files and the Software Workflow
The .ies file is a plain text file packed with the same candela data as the printed report, just structured for software to read directly rather than for a person to scan. It’s the input that turns a photometric report from a reference document into a working simulation.
Importing one into AGi32, DIALux, or Revit follows roughly the same steps in each program: import the file, place the fixture in your model at the correct mounting height, and confirm the orientation matches how it will actually sit on site. After import, run through this quick check:
- Orientation — confirm the 0 degree axis in the file lines up with how the fixture will be rotated on installation, since manufacturer conventions and simulation software don’t always agree on which direction counts as zero.
- Mounting height — verify it matches your actual site condition, not a generic default the software assumed.
- Reflectance and CU assumptions — check that room surface reflectances in your model reasonably match real finishes, since dark walls and ceilings pull real-world results below the simulation.
Most fixtures ship as .ies files in North America, but you’ll occasionally run into .ldt (Eulumdat) files common in European-manufactured products. If a manufacturer only offers .ldt and your software needs .ies, ask for a conversion or the correct native file rather than guessing.
Common Mistakes and a Fast Verification Routine
The single most common error is confusing LED chip lumens with luminaire lumens. A chip might be rated for 4,000 lumens, but after optics, housing, and thermal losses, the actual fixture might deliver 3,200. Reports that only quote chip lumens without a luminaire figure are hiding the number you actually need.
Other red flags: no LM-79 or LM-63 reference anywhere on the document, no named test lab, or a report with no accompanying .ies file at all. Each one is a reason to ask questions before you specify the fixture.
- Scan for luminaire lumens and efficacy, not chip lumens.
- Confirm an LM-79/LM-63 reference and a named, accredited lab appear somewhere on the report.
- Verify a usable .ies file exists and imports with correct orientation.
Pro Tip: Keep this three-item scan as a standing habit, not a special occasion. Running it on every fixture before it hits your schedule catches most bad data before it costs you a change order.
Report vs. Plan vs. Study: Which One Do You Actually Need?
These terms get used interchangeably, and that’s where most project confusion starts. A photometric report is fixture-level lab data, the input. A photometric analysis or study takes one or more of those .ies files and simulates them across an actual site layout. A photometric plan is the permit-ready drawing a municipal reviewer expects to see, built from that analysis.
A single fixture report, on its own, cannot substitute for a site plan in a permit review, because reviewers need to see how multiple fixtures interact across the whole property, not how one performs in isolation.
- Fixture report = raw lab data for one product.
- Analysis/study = simulation combining fixtures across your actual site.
- Plan = the finished, submittable drawing built from that analysis.
If your project needs municipal sign-off, budget time for the analysis step. It’s not optional, and it’s not the same document as the spec sheet sitting in your inbox.
Trust and Verification: LM-79, Labs, and Canadian Considerations
IES LM-79 is the testing standard that measures total luminous flux, intensity distribution, input power, CCT, CRI, and chromaticity for LED luminaires under controlled lab conditions. It’s the baseline that separates measured performance from a manufacturer’s marketing estimate.
Accreditation matters just as much as the standard itself. Look for a named lab and, ideally, a mention of accreditation such as NVLAP or an equivalent recognized body. An unnamed lab or a report with no accreditation statement isn’t automatically fraudulent, but it’s a reason to ask more questions before specifying the product on a project with rebate or code requirements. Canadian utility rebate programs and procurement specs increasingly reference LM-79 data directly when setting efficacy thresholds, so a report without that reference can complicate your rebate paperwork later, not just your design confidence now.
Practical Next Steps for Canadian Buyers and Designers
Montreal Lighting & Hardware structures product pages so LM-79 references and downloadable .ies files sit right alongside each fixture, not buried in a separate technical portal. The workflow is simple: confirm the LM-79 reference, download the .ies file, then import and check orientation in your software before you commit a fixture to a schedule.
For bigger projects, trade pricing and trade support help move you from verification straight into procurement without losing momentum on a Canadian timeline.
Why Reading a Photometric Report Actually Changes Project Outcomes
Designers who verify a fixture’s photometric data before specifying it catch mismatches early, and that habit quietly prevents a good share of on-site change orders. Installers benefit just as directly: clear orientation notes and mounting-height data mean fewer callbacks to re-aim or re-hang a fixture that was installed backwards. If a report or an .ies import ever leaves you stuck, the manufacturer’s or retailer’s team may be a straightforward call away.
— Montreal Lighting & Hardware
Where to Find Spec Sheets and Trade Support
Some Canadian lighting retailers provide buyers direct access to the data this whole process depends on, without the runaround. Product pages may carry downloadable spec sheets and .ies files right where you’re already browsing, so verification and procurement happen in the same session instead of two separate ones.

The Light Guide Ring LED Pendant by Sonneman is a good example of how that spec data shows up on a real product page, with performance details ready to check before you commit. For larger projects, whether it’s a full lighting schedule for a renovation or a bulk order across multiple units, the trade program gives design professionals and contractors preferred pricing and direct support pulling together schedules. If a fixture’s photometric data still feels unclear, or you want to see finish and beam pattern in person, visit the showroom or reach out to the team directly. Either way, the next step is simple: pick the fixture, pull its spec sheet, and confirm it fits your project before it goes on the schedule.
Sources
For deeper reference beyond this primer, the IES LM-79 and LM-63 standards remain the foundational documents behind every credible photometric report. Software guides for AGi32, DIALux, and Revit each publish their own import documentation covering .ies file handling and unit settings, worth checking whenever you switch between programs. For Canadian permit questions specifically, your municipality’s planning or building department publishes its own photometric plan requirements, and those requirements vary enough between cities that it’s worth confirming directly rather than assuming one city’s rule applies everywhere.
- How to Read a Photometric Report: Candela, Zonal Lumens, Spacing | Jarvis Lighting
- Photometric Plan vs. Study vs. Analysis vs. Report | Photometric Bureau
- How to Read a Photometric Report - LightLab International
- How to Read Photometrics Reports - CHAUVET Professional
FAQ
What Is a Photometric Report Used For?
A photometric report documents a single fixture’s measured light output, distribution, and color performance under LM-79 testing, and it supplies the .ies file that design software uses to simulate real installations.
How Do I Read a Photometric Plan Versus a Fixture Report?
A fixture report is lab data for one product; a photometric plan is a site-level, permit-ready drawing built by simulating multiple fixtures across your actual layout, and municipal reviewers expect the plan, not the raw fixture report.
What Does LM-79 Actually Measure?
LM-79 measures total luminous flux, intensity distribution, input power, CCT, CRI, and chromaticity for LED luminaires under standardized lab conditions, forming the basis for the numbers printed in the report.
Why Does the .ies File Matter More Than the Printed Report?
The printed report is for human review, but the .ies file is the machine-readable data that AGi32, DIALux, and Revit use to calculate actual illuminance on your site, making it the file you can’t skip.
What’s the Fastest Way to Spot a Bad Photometric Report?
Check for luminaire lumens (not LED chip lumens), a named LM-79 reference with an accredited test lab, and a usable .ies file. Missing any of the three is a reason to ask the manufacturer for clarification before specifying the fixture.
